Community Infrastructure Levy (CIL)
Section 2 Evidence
2.1 The preliminary draft charging schedule is informed by an appropriate evidence base, which identifies the infrastructure required to support the growth outlined in the Local Plan, the infrastructure funding gap (i.e. the amount of funding still to be found as of the date of the IDP after actual and expected sources have been identified) and an assessment of the likely impact of CIL on the viability of development across the borough. The evidence base documents include:
- An up to date Local Plan - Core Strategy (DPD1) available at: www.southend.gov.uk/corestrategy
- The Infrastructure Delivery Plan for Southend-on-Sea (IDP), June 2014 available at: www.southend.gov.uk/cil
- Southend-on-Sea CIL Viability Study, May 2014, and Viability Addendum Note (July 2014) BNP Paribas available at: www.southend.gov.uk/cil
2.2 The paragraphs below discuss these documents in more detail.
An up to date Local Plan
2.3 Statutory guidance (DCLG CIL Guidance February 2014, paragraph 2:2:1) sets out that councils must have an up to date development strategy for the area in which they propose to charge. And a charging authority must demonstrate how the proposed levy rates will contribute towards the implementation of the Local Plan.
2.4 Southend-on-Sea adopted its Core Strategy (Development Plan Document 1, DPD1) in December 2007 and for the purposes of CIL is considered to be relevant and up to date. Preparation of the Council's Preliminary Draft Charging Schedule has been based on the proposed levels of growth and development set out in DPD1 for the plan period up to 2021.
2.5 In 2007 an infrastructure assessment was undertaken as part of preparing the Local Plan, which identified the scale and type of infrastructure needed to deliver the area's local development and growth needs. As a considerable amount of time has passed since the Core Strategy's adoption it was deemed appropriate to commission an up to date Infrastructure Delivery Plan (IDP) to ensure that the infrastructure planning underpinning the Core Strategy accurately reflects the Council's latest priorities. The IDP (summary details included below) should be read in conjunction with this consultation document.
Southend-on-Sea's Infrastructure Requirements
2.6 The IDP looked at the following infrastructure categories:
- Schools and other educational facilities
- Health and social wellbeing
- Utilities
- Transport, including pedestrian facilities
- Flood defences
- Managing the impact of unstable land
- Emergency services
- Waste
- Social and community (including libraries, museums, galleries, arts and heritage, cemeteries, allotments and community halls)
- Leisure and recreational facilities (including children's play, youth and sports facilities)
- Open space/green infrastructure and public realm
2.7 The IDP and the Preliminary Draft Charging Schedule (PDCS) have been drafted in accordance with the CIL Regulations and statutory guidance (DCLG CIL Guidance February 2014, paragraph 2:2:2:1). These documents take into account the potential growth targets within the Core Strategy and set out the infrastructure that would be needed to support development and growth within the borough up to 2021. The Council has drawn together evidence from existing infrastructure planning documents and worked with a variety of infrastructure providers to understand their future requirements, including the costs for these and sources of funding.
2.8 Predicting infrastructure needs so far into the future is not straightforward. The detail of most development schemes is not known, the nature of public services can change and other unpredictable changes in services often occur. Therefore, the IDP represents current strategic thinking at this moment in time. It provides the Council with a good starting point and a guide for planning future infrastructure but should be considered as a live, working document that will be subject to revision as service requirements change and more detail is known regarding growth.
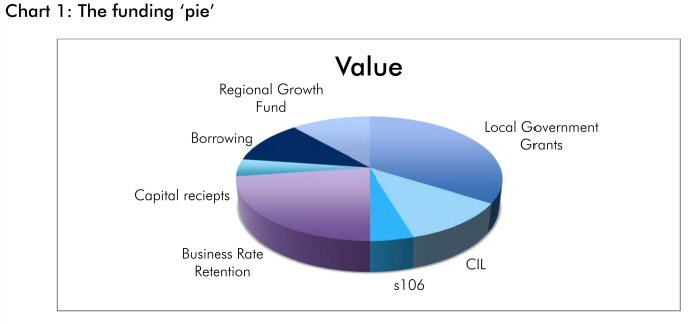
2.9 The costs identified in the IDP are for the period 2015 to 2021 to provide a strategic overview of what infrastructure is likely to be required as a result of emerging growth during the remaining plan period. Table 1 provides a summary of these costs by infrastructure category. In determining the size of its infrastructure funding gap, the Council has considered known and expected infrastructure costs and the possible sources of funding to meet those costs. This is not to say that additional sources of funding will not come forward during the Local Plan period but the process assists the Council, as a CIL charging authority, to identify a levy funding target in an effort to contribute to filling the funding gap identified as at the date of the IDP. As can be seen from the following indicative diagram, CIL cannot be expected to pay for all infrastructure required as a result of growth but forms part of a complex blend of funding.
Chart 1: The funding 'pie'
2.10 The infrastructure funding gap is calculated by considering the total 'Cost' for 2015-2021 minus total 'Funding' from known and reasonable funding streams in Table 1: £203,535,400 - £100,124,000 = £103,411,400
2.11 As at the date of the IDP, the evidence identifies a funding gap for 2015-21 of approximately £103.4 million. Whilst projects within the IDP may change, it is clear that the funding gap is significant and that there is a need for the CIL to contribute to infrastructure funding. Such a substantial funding gap is not unusual among local authorities; for example, Thurrock identified an infrastructure funding gap of £446.14m (as at 31 st March 2013) and Chelmsford identified an infrastructure funding gap of £113m ("Updated Infrastructure Planning and Funding Gap Assessment, February 2013", Chelmsford City Council). It should be noted that the cost of purchasing land for some infrastructure has not been included in the IDP, as it is not known which elements may or may not require this. There are also some gaps where providers have not been able to comment or where further information is required; in which case the funding gap is likely to increase.
2.12 The role of the IDP is not to provide absolute assurances as to how the Council intends to spend CIL, but to illustrate that the intended CIL targets are justifiable given local infrastructure need and based on appropriate available evidence. It is not a formal investment programme and does not entail commitment by the Council or other statutory providers.
Table 1: Summary of infrastructure costs
|
Infrastructure category |
Cost |
Funding (known) |
Funding gap |
|---|---|---|---|
|
Education |
£19,500,000 |
£0 |
£19,500,000 |
|
Health |
£624,000 |
£0 |
£624,000 |
|
Social services/over 50s support |
Not known |
Not known |
Not known |
|
Waste water |
£0 |
£0 |
£0 |
|
Potable water |
£0 |
£0 |
£0 |
|
Gas |
£0 |
£0 |
£0 |
|
Electricity |
£12,304,000 |
£12,304,000 |
£0 |
|
Transport |
£53,000,000 |
£25,000,000 |
£28,000,000 |
|
Flooding and unstable land |
£43,170,000 |
£39,140,000 |
£4,030,000 |
|
Police |
£7,500,000 |
£1,000,000 |
£6,500,000 |
|
Fire |
£0 |
£0 |
£0 |
|
Ambulance |
Not known |
Not known |
Not known |
|
Waste |
£8,660,000 |
£5,020,000 |
£3,640,000 |
|
Libraries |
£3,630,000 |
£380,000 |
£3,250,000 |
|
Museums and galleries |
£35,000,000 |
£15,000,000 |
£20,000,000 |
|
Other arts, theatres and heritage |
Not known |
Not known |
Not known |
|
Cemeteries |
£2,280,000 |
£2,280,000 |
£0 |
|
Allotments |
£1,250,000 |
£0 |
£1,250,000 |
|
Community halls |
£1,622,400 |
£0 |
£1,622,400 |
|
Children's play |
£310,000 |
£0 |
£310,000 |
|
Youth facilities |
£790,000 |
£0 |
£790,000 |
|
Outdoor sports |
£1,195,000 |
£0 |
£1,195,000 |
|
Indoor sports |
£0 |
£0 |
£0 |
|
Other recreation |
£1,700,000 |
£0 |
£1,700,000 |
|
Open space/public realm |
£11,000,000 |
£0 |
£11,000,000 |
|
Green infrastructure |
Not known |
Not known |
Not known |
|
Total |
£203,535,400 |
£100,124,000 |
£103,411,400 |
* Substantial bid has been made to the Growth Fund and outcome will be known in July 2014. For the purpose of this study, it has been assumed that approximately 50% of the total amount included in the bid for £42.24m will be awarded, however this figure will be updated once the final grant award is known.
(3) QUESTION 1:
Do you agree with the contents of the IDP and does the evidence show that there is a sufficient funding gap and justification to introduce a CIL?
Viability Study
2.13 In order to establish what proportion of the funding gap could be funded through a CIL, a viability assessment was undertaken by BNP Paribas on behalf of the Council. The CIL Regulations are clear that a CIL should not put at serious risk the overall development of an area, and that there would need to be an appropriate balance between using CIL to help fund infrastructure and the economic effects (taken as a whole) on development across the borough (hereafter referred to as the 'balance test').
2.14 Guidance published by The Local Housing Delivery Group (chaired by Sir John Harman) in June 2012, "Viability Testing Local Plans", states the following in defining 'viability':
"An individual development can be said to be viable if, after taking account of all costs, including central and local government policy and regulatory costs and the cost and availability of development finance, the scheme provides a competitive return to the developer to ensure that development takes place and generates a land value sufficient to persuade the land owner to sell the land for the development proposed. If these conditions are not met, a scheme will not be delivered."
2.15 It is worth noting that even where the Viability Study identifies some types of development as unviable this does not mean that sites will not be developed within the Borough. Viability is only one of many factors which affect whether a site is developed. For example, commercial owner occupiers may wish to locate in Southend-on-Sea. Alternatively, a business may wish to develop their own premises by reference to their own cost benefit analysis, which will bear little relationship to the residual land value calculations that a speculative landlord developer may undertake.
2.16 The results of the development appraisals and analysis in the study indicate a degree of variation in viability of development in terms of different uses. In light of these variations, two options are available to the Council under the CIL regulations:
i) The Council could set a single CIL rate across the City, having regard to the least viable types of development and least viable locations. This option would suggest the adoption of the 'lowest common denominator', with sites that could have provided a greater contribution towards infrastructure requirements not doing so. In other words, the Council could be securing the benefit of simplicity at the expense of potential income foregone that could otherwise have funded infrastructure.
OR
ii) The Council has the option of setting different rates for different types of development.
The results of the Viability Study point firmly towards the second option and this is therefore the proposed route.
2.17 The key findings of the Viability Study are summarised as follows:
Residential
2.18 A series of development typologies were appraised in the Viability Study, reflecting both the range of sales values/capital values and also sizes/types of development and densities of development across the Southend area. The inputs to the appraisals were based on research of the local housing market and data from other identified sources.
2.19 Residential values in the area reflect national trends in recent years but do of course vary between different sub-markets. The Viability Study considered comparable evidence of transacted properties in the area and also properties on the market to establish appropriate values for each scheme for testing purposes. This exercise indicates that developments in the Borough will attract average sales values ranging from circa £3,229 per square metre (£300 per square foot) to £1,938 per square metre (£180 per square foot). In general higher values are achieved along the seafront and particularly in the Leigh-on-Sea, Chalkwell and Thorpe Bay areas. The market areas are illustrated in the map shown in Figure 1 below and the following average sales values were applied in the appraisals reflecting the ranges shown on the map:
Table 2: Average sales values adopted in Southend-on-Sea appraisals
|
Area |
Ave values £s per square metre |
Ave values £s per square foot |
|---|---|---|
|
1 - North central area, Airport, Westborough, Victoria and Prittlewell |
£1,938 |
£180 |
|
2 - Southchurch |
£2,153 |
£200 |
|
3 - Mid central area |
£2,369 |
£220 |
|
4 - Shoeburyness |
£2,476 |
£230 |
|
5 - Eastwood, Belfairs and Blenheim |
£2,530 |
£235 |
|
6 - South central area (below railway) |
£2,799 |
£260 |
|
7 - Thorpe Bay |
£2,960 |
£275 |
|
8 - Leigh-on-Sea and Chalkwell |
£3,229 |
£300 |
2.20 In relation to affordable housing, social rents have been tested at target rents and the study has modelled affordable rent units based on 80% of market rents for the rented element of our appraisals, as long as these do not exceed the Local Housing Allowance levels. These are shown in Table 3.
.jpg)
Table 3: Summary of average private rents, 80% of private rents and Local Housing allowance levels
|
Property type |
Ave Market Rent per week |
80% of Market Rent per week |
Local Housing Allowance (per week) |
Rent adopted in study |
|---|---|---|---|---|
|
One bed |
£138.46 |
110.77 |
£114.23 |
£110.77 |
|
Two bed |
£173.08 |
138.46 |
£149.76 |
£138.46 |
|
Three bed |
£230.77 |
184.62 |
£184.62 |
£184.62 |
|
Four bed |
£300.00 |
£240.00 |
£229.62 |
£229.62 |
2.21 The ability of residential schemes to make CIL contributions varies depending on the area and the current use of the site. Having regard to these variations, residential schemes should be able to absorb a maximum CIL rate of between a nominal rate of around £20 per square metre and £100 per square metre. DCLG guidance requires that charging authorities do not set their CIL at the margins of viability. Other authorities have set their rates at a discount (buffer) to the maximum rate, with discounts ranging from circa 20% to 50%. On this basis, a buffer of circa 30% is recommended for Southend-on-Sea Borough Council.
2.22 Taking a broad view across the appraisals in the study, the maximum and suggested residential rates are as follows:
Table 4: Maximum and suggested CIL rates - residential
|
Market Areas |
Maximum CIL indicated by appraisals (£ per sqm) |
CIL after buffer (£ per sqm) |
Suggested three Zone Approach to CIL (£ per sq m) |
|---|---|---|---|
|
1 - North central area, Airport, Westborough, Victoria and Prittlewell |
N/A |
Nominal rate of around £20 |
£20 |
|
2 - Southchurch |
N/A |
Nominal rate of around £20 |
£20 |
|
3 - Mid central area |
N/A |
Nominal rate of around £20 |
£20 |
|
4 - Shoeburyness |
£30 |
£21 |
£20 |
|
5 - Eastwood, Belfairs and Blenheim |
£30 |
£21 |
£20 |
|
6 - South central area (below railway) |
£50 |
£35 |
£30 |
|
7 -Thorpe Bay |
£80 |
£56 |
£60 |
|
8 - Leigh-on-Sea and Chalkwell |
£100 |
£70 |
£60 |
2.23 Whilst the maximum rates are higher than the suggested rates, the inclusion of a buffer will help to mitigate a number of risk factors (primarily the potentially adverse impact on land supply of setting the rates at a high level and 'shocking' the market). However, there is no prescribed percentage buffer and this is entirely a matter for the charging authority's judgement.
2.24 As identified in Table 4, it is recommended that consideration be given to combining areas into one charging zone, thereby simplifying the charging schedule into less charging areas to avoid undue complexity, which could result in a cumbersome administrative process and difficulties in establishing area boundaries. It is also worth noting that Market Areas 1, 2 and 3 have been identified as being generally unviable and as such the application of CIL is unlikely to be the defining factor in scheme delivery. The imposition of CIL at a zero level will not make schemes viable, nor will the imposition of a nominal CIL charge affect the delivery of the Local Plan. Other factors (i.e. sales values, build costs or benchmark land values) would need to change to make the scheme viable. In this regard it is recommended that with a 30% viability buffer the Council considers a nominal rate of around £20 per square metre for Market Areas 1-5, a maximum rate of £35 per square metre for Market Area 6, and a rate between £56 and £70 per square metre for Market Areas 7 and 8.
2.25 The appraisals for extra care and retirement housing (see Table 9 for definition) identify that such developments generate surpluses that would support a CIL Charge to varying degrees depending on the existing use of the site. On this basis it is recommended that a nominal rate of £20 per square metre be adopted across the entire Borough for such development.
Commercial
2.26 A series of commercial development typologies were also appraised, reflecting a range of use classes at average rent levels achieved on lettings of commercial space in actual developments. In each case, the assessment assumes an intensification of the existing use on the site, based on the same type of commercial development. In each case, the assessment assumes an intensification of the site, based on a range of current commercial use values. In each case, the existing use value assumes that the existing building is 30%-50% of the size of the new development, with a lower rent and higher yield reflecting the secondary nature of the building.
2.27 Office development: At current rent levels, office development across the Borough is unlikely to generate sufficient surpluses to accommodate a CIL charge. A nil or nominal rate is therefore recommended for office development.
2.28 Industrial and warehousing: These uses are unlikely to generate positive residual land values. A nil or nominal rate is therefore recommended for these uses.
2.29 Convenience based supermarkets and superstores and retail warehousing (net retailing space of over 280 square metres) are likely to be viable across the Borough with a maximum CIL rate of £106 per square metre. After allowing for a buffer, which we consider to be appropriate to deal with site specific issues, a £70 per square metre CIL rate is recommended.
2.30 Residual values generated by all other forms of retail (A1-A5) developments are higher than current use values to varying degrees across the Borough. However, to a degree smaller retail development will involve the re-use of existing retail space, which will not be CIL liable. In order to capture value from schemes that add floorspace, and in particular larger format stores that generate higher value, differential rates are recommended.
- Residual values generated by all other retail (A1-A5) developments in the primary shopping area of Southend Town Centre are identified as unlikely to generate significant surpluses to fund CIL. The residual land values are only likely to exceed current use values by a small margin to allow for a CIL to be levied on sites in a lower value use i.e. offices instead of existing retail use. On this basis it is recommended that a nil or nominal rate be adopted for retail development in the prime shopping area of Southend Town Centre.
- Leigh-on-Sea and elsewhere in the Borough, rents for all other retail (A1-A5) development are considerably lower and the appraisals identify that developments are unable to viably support a CIL charge. A nil or nominal rate is therefore recommended for retail development outside the prime shopping area.
2.31 At current values hotel developments are identified as not being able to generate a surplus and in this regard it is recommended that a nil or nominal rate be set for hotel use.
2.32 All other uses that have not been discussed above include D1, D2 and sui generis uses. Individual viability testing of the large and varied range of possible uses that could come forward in this category has not been undertaken as it would be too complex to test with any degree of reliability. Some uses in this category would be viable, generating reasonably high revenues. However, some uses in this category would not be viable for the most part; this typically includes community facilities that do not accommodate revenue generating operations. It is therefore suggested that a nil or nominal rate could be applied to all other uses not referred to in paragraphs 2.21 - 2.31. If a nominal rate is adopted (with some exceptions for community facilities, emergency services, and public healthcare and education) it is unlikely to be a major factor in developers' decision making and could be absorbed without having a significant impact on viability and deliverability of development across the Borough.
Sensitivity Analysis
2.33 The housing and commercial property markets are inherently cyclical and the Council is testing its proposed rates of CIL at a time when the market is recovering after a severe recession.
2.34 Residential values in Southend have recovered to a degree but still remain circa 8.4% below the 2008 peak levels. [1] Forecasts for future house price growth indicate continuing growth in the 'mainstream' UK and East of England markets. Current experience in Southend-on-Sea indicates that delivering the Council's affordable housing targets is possible, although challenging in many cases. The Council have on occasions accepted a reduced level of provision upon the acceptance of a proven viability case.
2.35 The Viability Study has allowed for the following scenarios in the sensitivity analyses that have been applied in the viability testing:
- Increase/decrease in sales values and build costs
- Reduced affordable housing (20%, 10% and 0%)
- Different tenures of affordable housing including Affordable Rent and Social Rent
2.36 Sensitivity analyses have also been incorporated into the commercial appraisals to allow for changes in rent levels and yields.
2.37 A key point to note in the residential viability testing is that even a reduction in affordable housing does not always remedy viability issues. In these situations, it is not the presence or absence of planning obligations that is the primary viability driver - it is simply that the value generated by residential development is lower than some existing use values. In these situations, sites would remain in their existing use.
2.38 Further details in relation to the sensitivity analyses can be found in the Viability Study available as part of this consultation.
Viability 'Buffer'
2.39 The results of the Viability Study indicate that although viability of development is currently challenging in certain locations and for many uses, it should be possible for rates of CIL to be levied across the Borough. However, this approach is subject to allowing for a buffer or margin to address risks to delivery. There are four key risk factors:
- Individual sites might incur exceptional costs (decontamination, difficult ground conditions etc.) and as a result the residual land value could fall. Developers will try and reflect such costs in their offer to the landowner, but the extent of any issues is not always fully apparent until the land value is fixed. Where sites have an existing use, an owner will not be prepared to accept a reduction below the value of the current building to accommodate exceptional costs on a redevelopment;
- Current use values on individual sites will inevitably vary and will fall somewhere between the values used in our appraisals. As a result, the ability of schemes to absorb high rates of CIL could be adversely affected.
- Sales values could fall or normal build costs could rise over the life of the charging schedule, adversely affecting scheme viability. While the Council could change its rates to adapt to these changes, this cannot be done quickly due to the need to develop a refreshed evidence base and follow the statutory consultation and examination process; and
- Imposing a high rate of CIL (that vastly exceeds the current levels of Section 106 obligations) in the Council's first charging schedule could 'shock' the land market with a consequential risk that land supply falls. This factor has led many charging authorities to seek to limit their CIL rates to no more than around 3-5% of development costs, or to set their CIL rates so that they are broadly comparable to existing Section 106 contributions.
2.40 The rates suggested in Section 3 are based on the finding of the Viability Study and are considered to include a suitable buffer that strikes an appropriate balance between collecting money for infrastructure whilst not putting the viability of development seriously at risk. The analyses included in the following paragraphs in this section seek to evidence this.
2.41 Tables 5 and 6 show the suggested CIL rates as a proportion of the maximum viable rate and as a % of the Gross Development Value (i.e. to take into account scheme income, development costs and amount available to pay for land).
Table 5: CIL as a proportion of scheme value - residential
|
CIL Market Areas |
Maximum CIL (£s per sqm) [2] |
Suggested CIL (£s per sqm) |
Suggested CIL as % of maximum viable rate |
Suggested CIL as % of Gross Development Value [3] |
|---|---|---|---|---|
|
Area 1 |
N/A |
Nominal rate of around £20 |
N/A |
1.2% |
|
Area 2 |
N/A |
Nominal rate of around £20 |
N/A |
1.1% |
|
Area 3 |
N/A |
Nominal rate of around £20 |
N/A |
1.0% |
|
Area 4 |
£30 |
£20 |
67% |
0.9% |
|
Area 5 |
£30 |
£20 |
67% |
0.9% |
|
Area 6 |
£50 |
£30 |
60% |
1.1% |
|
Area 7 |
£80 |
£60 |
75% |
2.1% |
|
Area 8 |
£100 |
£60 |
60% |
2.0% |
2.42 As can be seen from Table 5, for residential schemes, the application of CIL is unlikely to be an overriding factor in determining whether or not a scheme is viable. When considered in the context of total scheme value, CIL will be a modest amount, typically accounting for between 0.9% and 2.0% of GDV. Some schemes would be unviable even if a zero CIL were adopted. The Viability Study therefore recommends that the Council pays limited regard to these schemes.
Table 6: CIL as a proportion of scheme value - commercial
|
Use |
Maximum CIL (£s per sqm) |
Suggested CIL (£s per sqm |
Suggested CIL as % of maximum viable rate |
Suggested CIL as % of Gross Development Value [4] |
|---|---|---|---|---|
|
Office |
N/A |
Nominal rate of around £10 |
N/A |
0.35% |
|
Industrial and warehousing |
N/A |
Nominal rate of around £10 |
N/A |
0.82% |
|
All other retail (A1-A5) |
N/A |
Nominal rate of around £10 |
N/A |
0.26% |
|
Hotel |
N/A |
Nominal rate of around £10 |
N/A |
0.38% |
|
Convenience based supermarkets and superstores and retail warehousing (net retailing space of over 280 square metres) |
£106 |
£70 |
66% |
2.54% |
2.43 And as can be seen from Table 6, with respect to commercial schemes, the application of a nominal CIL is unlikely to be the determining factor in whether a developer brings forward a site or whether not a scheme is viable. The suggested nominal charge of £10 per square metre is a marginal factor in a scheme's viability i.e. less than 1% of GDV in terms of the uses tested. The CIL Guidance identifies that a charging authority does not have to set a nil rate, the setting of a nominal rate would allow the Council to achieve the balance required by the CIL regulations between the delivery of development and the provision of infrastructure to support the growth envisaged in the Council's local plan. In addition, it is considered that the suggested £70 per square metre rate, at 66% of the maximum viable rate and 2.54% of GDV for large supermarkets, superstores and retail warehousing meets the balance test as outlined in paragraph 2.13.
2.44 Also to inform the Viability Study and PDCS, an analysis of Section 106 records was carried out for the period April 2008-December 2013 (inclusive), the relevant extracts of which are included below:
|
Total amount requested for residential only schemes (exluding pooled contributions other than affordable housing in lieu payments [5] ): |
£950,072 |
|
If analyse residential only schemes (939 units) and exclude pooled contributions: total amount requested on those schemes/no. of open market and affordable housing residential units = average £ contribution /residential unit |
£1,012 |
|
Total amount requested for commercial only schemes (excluding pooled contributions): |
£873,970 |
|
If analyse commercial only schemes and exclude pooled contributions: total amount requested on those schemes/total sqm (46,159sqm) = average £ contribution /sqm |
£19 |
2.45 The appraisals supporting Southend's proposed CIL rates have factored in an allowance to address any costs of site specific mitigation (payable in addition to CIL) based upon the above s.106 analysis/average rates.
2.46 Table 8 shows the CIL liability that would be payable for a range of dwelling types in the three proposed residential charging zones:
2.47 Whereas in many areas house prices have fallen in the last 5 years, in Southend the average house price increased by as much as £16,092 between November 2012 and November 2013 (TGSE Housing Market Trends Quarterly Report January 2014). To provide some context to the cost of CIL is relation to residential property values, the CIL estimated liabilities shown in Table 8 would represent 0.01% in Southend in Zones 1 and 2, and 0.02% of the average property price in Zone 3, and for all dwelling types. This is considered to be a nominal amount for a developer although cumulatively such contributions will be critical to assisting in the delivery of infrastructure to support development.
Table 8: Suggested CIL rates applied to different dwelling types
|
Dwelling type |
Average internal floor area (sqm) [6] |
Average value in Zone 1 (Market areas 1-5) (£) [7] |
Suggested CIL in Zone 1 £20/sqm (£ per average dwelling) |
Average value in Zone 2 (Market area 6) (£) [8] |
Suggested CIL in Zone 2 £30/sqm (£ per average dwelling) |
Average value in Zone 3 (Market areas 7 and 8) (£) [9] |
Suggested CIL in Zone 3 £60/sqm (£ per average dwelling) |
|---|---|---|---|---|---|---|---|
|
Studio (1 bed space) |
37.5 |
85,988 |
750 |
104,963 |
1,125 |
116,063 |
2,250 |
|
1 bedroom flat (2 bed space) |
45 |
103,185 |
900 |
125,955 |
1,350 |
139,275 |
2,700 |
|
2 bedroom flat (3 bed space) |
57 |
130,701 |
1,140 |
159,543 |
1,710 |
176,415 |
3,420 |
|
2 bedroom flat (4 bed space) |
67 |
153,631 |
1,340 |
187,533 |
2,010 |
207,365 |
4,020 |
|
3 bedroom flat (5 bed space) |
75 |
171,975 |
1,500 |
209,925 |
2,250 |
232,125 |
4,500 |
|
3 bedroom flat (6 bed space) |
85 |
194,905 |
1,700 |
237,915 |
2,550 |
263,075 |
5,100 |
|
2 bedroom house (3 bed space) |
66 |
151,338 |
1,320 |
184,734 |
1,980 |
204,270 |
3,960 |
|
2 bedroom house (4 bed space) |
77 |
176,561 |
1,540 |
215,523 |
2,310 |
238,315 |
4,620 |
|
3 bedroom house (5 bed space) |
82 |
188,026 |
1,640 |
229,518 |
2,460 |
253,790 |
4,920 |
|
3 bedroom house (6 bed space) |
95 |
217,835 |
1,900 |
265,905 |
2,850 |
294,025 |
5,700 |
|
4 bedroom house (7 bed space) |
108 |
247,644 |
2,160 |
302,292 |
3,240 |
334,260 |
6,480 |
|
AVERAGE |
72 |
165,617 |
1,445 |
202,164 |
2,167 |
223,544 |
4,334 |
2.48 In summary, it is considered that a suitable viability buffer has been taken into account in proposing rates to allow for site specific mitigation under s.106/s.278/planning conditions in addition to CIL without affecting viability across the Borough such that CIL puts at risk delivery of the Local Plan.
(9) QUESTION 2:
Do you agree with the assumptions, methodology and conclusions of the Viability Study? If you disagree please explain reasons and justification for any alternatives.
[1] As identified from the Land Registry's online House Price Index database ( http://www.landregistry.gov.uk/public/house-prices-and-sales/search-the-index )
[2] The percentages for residential schemes are based on the appraisals for site type 5.
[3] The percentages here assume that CIL is levied on the entire floorspace of the development (except for affordable housing, which benefits from affordable housing relief) and that there is no deduction for existing floorspace. These percentages therefore represent the worst case scenario.
[4] The percentages here assume that CIL is levied on the entire floorspace of the development and that there is no deduction for existing floorspace. These percentages therefore represent the worst case scenario. Gross Development Value (GDV) is defined as the total current market value of the completed scheme.
[5] The Council currently pools contributions relating to general education or public realm or public transport improvements from a number of developments. However, from April 2014 the pooling restriction as outlined in paragraph 1.16 will apply. Therefore, any contributions that are currently pooled have been excluded from the analysis to accurately reflect the residual s.106 payment that may be due in addition to CIL (with the exception of affordable housing as this is not included in CIL).
[6] The average floor areas have been based on Policy Table 4 (Indicative Residential Space Standards) of the Submission Version Development Management DPD (March 2014).
[7] Average value of residential property in market areas 1-5 (Zone 1) has been found to be £2,293/sqm - see Table 2.
[8] Average value of residential property in market area 6 (Zone 2) has been found to be £2,799/sqm - see Table 2.
[9] Average value of residential property in market areas 7 and 8 (Zone 3) has been found to be £3,095/sqm- see Table 2.